
Here is an example of the tool in practice. We've got a vegetation mortality event that can be mapped using satellite imagery. We've done this going back over twenty years at an annual time step. Each grid cell is coded either 1 or 0. The figure on the left shows the number of times that this event has occurred. We can see that in this area the event has occurred up to five times.
Now we run the duration tool to see if the event tends be in the same place in consecutive years.The figure below left shows that only very rarely do we see three consecutive years as having an event. Mostly we see two or even just a single consecutive events.
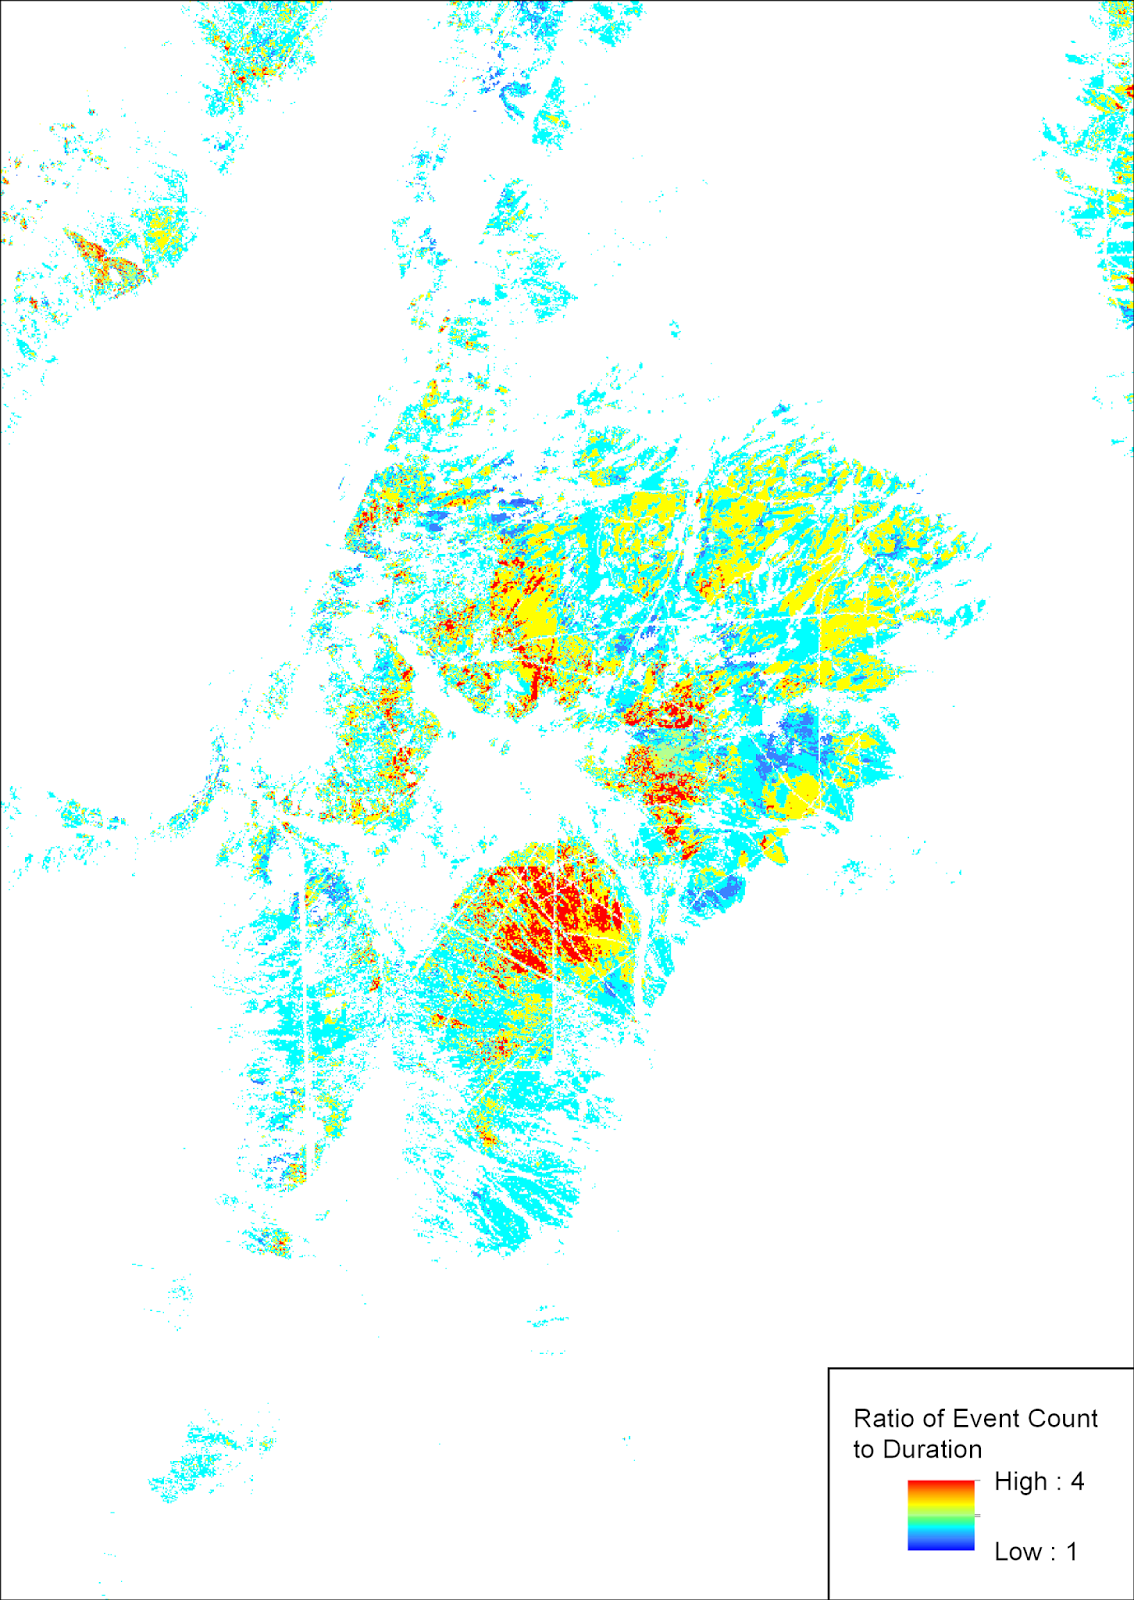
The figure below bottom shows the ratio of the count of events to the duration of events. The values range from 1 to 4 indicating that events have re-occurred in many of these areas up to four times.


No comments:
Post a Comment