Back in my September 29, 2018 post I promised a three part blog post on the Miscellaneous Hydrology Tools for ArcGIS. After a long absence here is part II - a detailed description of Find Inflow Cells Tool. You can read the original blog post by clicking
HERE or download the tool be clicking
HERE.
There are plenty of examples of situations in which we may want to figure out which cells flow in and which ones flow out of a watershed. Standard watershed tools, such as Basin in Spatial Analyst, will easily give us the outflow cells. Finding the inflow cells can be a little bit trickier, hence the reason for this new tool.
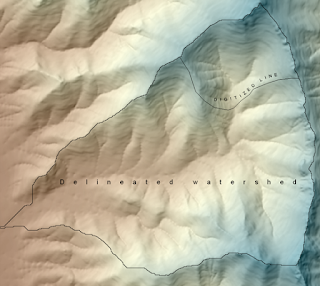
On the left is an example of a watershed in which I digitized a cut line that separates the northern 1/4 from the rest of the watershed. The goal in this example is the use the Find Inflow Cells tool to identify which cells from the northern 1/4 flow into the rest of the watershed. This could be useful for identifying likely entry points into a watershed. One scenario might be for a proposed development within a watershed in which we want to identify all entry points and mitigate for those by implementing some sort of erosion control. This tool would be well suited for those sorts of applications. If we were interested in identifying downslope cells that are likely to be affected then we may use this tool in conjunction with the Trace Downstream tool that I will cover in my next post.
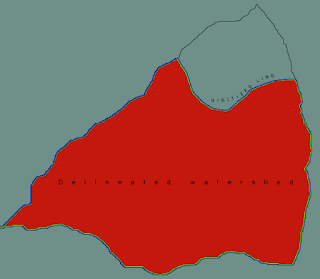
The image on the right illustrates the first step that the Find Inflow Cells undertakes. The entire watershed is rasterized and the Expand and Shrink tools in Spatial Analyst are used to generate an "inner buffer" and an "outer buffer". These are one cell wide buffers both inside and outside of the watershed. The inner buffer refers to the outermost cells within the watershed; candidates into which flow can occur. The outer buffer refers to the cells immediately adjacent from which flow can flow from. In the image on the right the outer buffer is blue and the inner buffer is green. The remaining cells in the watershed are red and the cells outside the watershed are gray.
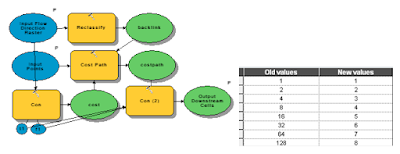
The image on the left shows the model as seen in ModelBuilder. Bear with me as I know that it is a little difficult to read. If you are really interested in the inner workings of this tool or any other I'd encourage you to crack open the model in ModelBuilder and examine the steps on your own computer. You'll
see that it is actually quite repetitive and not nearly as complicated as it looks. It performs the standard hydrologic steps of filling the DEM, calculating flow direction, and calculating flow accumulation. Then the tool shifts the flow direction, flow accumulation, and outer buffer rasters in each of the eight directions. The following types of raster calculator statements are used to determine if a cell has positive inflow: ("%inner%" * "%ne_con%" * (Con("%ne_fdr%" == 8,1,0)))*8. A value of 8 is used to determine flow from the northeast to southwest directions. This is repeated for all of the directions using values of 16, 32, 64, 128, 1, 2, and 4 to represent the east, southeast, south, southwest, west, northwest, and north neighbors. A similar, but simpler, statement is used for flow accumulation: ("%inner%" * "%ne_con%"*"%ne_fac%"). Finally, values are summed to produce the flowdirection2 raster and then reclassified into 1 and 0 to produce the flowdirection1 raster. Similarly, flow accumulations are summed. Finally, the raster cells with inflow are converted to points.
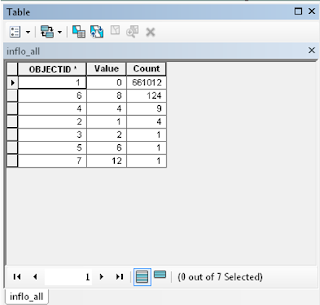
Inflow2 and Inflow1 differ, because Inflow2 can be used to determine which cells flow into the focal cell. Inflow1, in contrast, just codes all cells with inflow as 1 and all cells that have no inflow as 0. In the example table in the left image most cells have no inflow or are not boundary cells (99.9%). The most common direction of inflow is from the northeast (value=8), followed by north, east, and southeast. The values of 6 and 12 are not values of flow direction, but rather represent combinations of two values. Six is most likely a combination of 1 north and 1 east flowing cell. Twelve is most likely a combination of 8 and 4 representing northeast and north respectively.
The image on the right shows the spatial representation of the attribute table shown above. This is the Inflow2 raster. The lilac color represents flow crossing the barrier from northeast to southwest. The next most common color green representing flow from north to south. The cell at the bottom of the drainage that is red represents flow from the northwest to southeast.
The image to the right shows the Inflow1 raster. It represents cells with inflow and are shown as bright green. Cells around the perimeter of the watershed have no inflow because the watershed was defined using standard hydrological tools in Spatial Analyst (Fill, Flow Direction, Flow Accumulation, and Watershed).
Individual flow directions can be obtained by running the tool from the ModelBuilder dialog window (right-click and select edit). This is an optional, but potentially useful, step that some advanced users may be interested in.
In the picture on the left inflow cells are colored by flow accumulation. Most of the cells with inflow (blue) are located close to ridges but contribute less flow than cells in the valley bottom (red).
In the picture at the bottom of the page cells have been converted into points which are shown as graduated symbols. Larger dots represent more flow than small dots. As can be seen the cells with the most inflow are located in the valley bottom.
This is it for this week. Next up will be a post on the Trace Downstream Tool, which is a companion and extension for this tool.

 The picture on the right shows the results of the Trace Downstream tool. Input points are the light blue points and red cells represent grid cells located downstream from those points. This tool could be used for a number of hydrological applications. For example, we may be interested in tracing a pollutant downstream. We may also be interested in identifying concentrated flow paths from overland flow. Finally we might want to use a tool such as this one to identify locations for placing erosion or pollutant control measures in order to maximize efficacy while controlling costs. For example, it might be most effective to place two to three measures in areas where flow is concentrated rather than dozens along the perimeter of the inflow area.


