We are advertising two positions in our lab - one for an M.S. student and the other for a postdoctoral researcher. Read the descriptions HERE
With this blog I intend to share GIS, remote sensing, and spatial analysis tips, experiences, and techniques with others. Most of my work is in the field of Landscape Ecology, so there is a focus on ecological applications. Postings include tips and suggestions for data processing and day-to-day GIS tasks, links to my GIS tools and approaches, and links to scientific papers that I've been involved in.
Thursday, August 25, 2016
Friday, August 12, 2016
Cheatgrass die-offs the movie
Our lab has been working on accurately mapping a phenomenon known as cheatgrass die-off. Although the exact mechanism responsible for a cheatgrass die-off is still being figured out it is thought that a combination of a fungal pathogen along with certain weather conditions and litter accumulation are responsible for creating these stand failure events. We've been using Landsat to map 35 years of cheatgrass die-off in the Winnemucca area of Nevada. We plan to publish our results in a forthcoming journal article very soon, but in the mean time we have added a link to a movie file (AVI) showing cheatgrass die-off by year. Sit back and enjoy.
Downloads page
Downloads page
Thursday, August 11, 2016
Zonal versus focal statistics
 One of the main purposes of a Geographic Information System is to
extract information. We do this all
One possible solution to his problem was the use of focal statistics rather than zonal statistics for extracting information. This works especially well for buffers around points since the buffers will always be the same size. Focal statistics provide options for rectangle buffers or circular buffers. Focal statistics are nice because if new points are added then the rasters are already there. There is no need to re-run anything other than extracting the values to points. Focal statistics are sensitive to edge effects so be cautious with points located near the boundary of a raster.

Zonal statistics, on the other hand, are preferable in situations with irregularly shaped zones (often polygons) like watersheds or administrative units like counties. Zonal statistics can be made to work with overlapping polygons with a little extra work. Usually this involves unioning the overlapping polygons, finding areas common to more than one point, and then doing some sort of area weighted average.
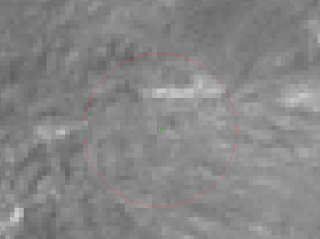
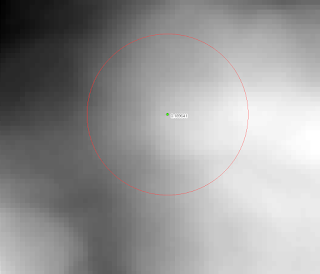
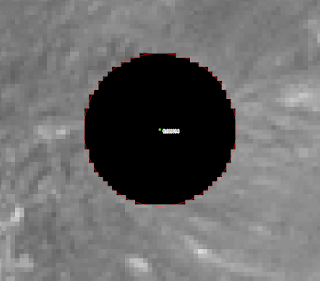
In the examples on the right we have a buffered point and underlying raster (top), buffered point on a focal mean raster (middle), and a buffered point that has had zonal statistics run on it (bottom). Focal statistics yielded a value of 0.189641 and zonal statistics got us 0.189814. The differences are probably due to a single or a small handful of cells that differed as to whether they were included or not in the buffer. I think that for the many applications this small of a discrepancy shouldn't matter.
Subscribe to:
Posts (Atom)

