Tuesday, April 28, 2020

Height Above Nearest Drainage goes mainstream in QGIS and ArcGIS

Between 2008 and 2016 Camilo Rennó and Antonio Nobre and co-authors published a series of papers describing "Height Above Nearest Drainage" (HAND), an approach for measuring the height above a mapped stream channel. Their approach basically involves identifying watersheds for each cell in a stream and relating that the to the upslope area through a join.  HAND is defined, more of less, as the difference between the elevation of a grid cell and the downslope elevation where it flows into the stream.

In 2011 I created an ArcGIS Toolbox called the "Riparian Topography Toolbox" and added a tool to calculate HAND. Height Above Nearest Drainage differs "Height Above River", which is calculated as the difference in elevation between a grid cell and a weighted average of grid cells within a stream. The two methods are conceptually similar although HAR uses multiple grid cells within a river.  Hence, it is more appropriate for deriving vertical height for LIDAR DEMs rather than typ
ical 10 or 30 meter DEMs.  HAND, on the other hand, is expected to be more computationally-efficient and more appropriate on coarser-scale DEMs.

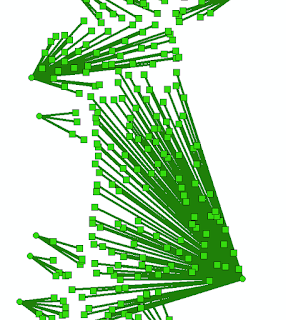
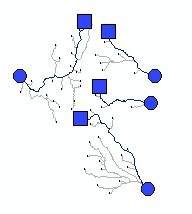
As of ArcGIS version 10.7.1, I noticed that ArcGIS is now including a tool called "Flow Distance" in the Hydrology Toolset in ArcToolbox. This tool has an option for calculating distance in either horizontal or vertical distances. The vertical option appears to be equivalent to HAND so I decided to check it out.  I ran the "Flow Distance" tool on some of my study watersheds to see what the output looks like. The image on the left shows five sample watersheds with streams in blue, pour points as red dots, and watershed boundaries in black. The output from the Flow Distance tool is shown as a yellow to green to blue color ramp.

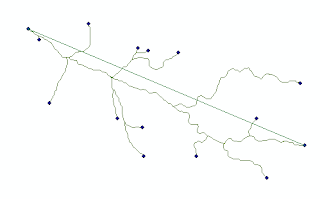
The image on the right shows the output from Flow Distance after thresholding into two classes: above and below 15 meters vertical height above stream channels. Purples are the areas below 15 meters and tan are the areas above 15 meters. You can see the some watersheds tend to have narrower riparian areas than others.

QGIS has an equivalent version of this tool.  It is called Terrain Channels and it also has a vertical component.

ArcGIS Flow Distance - https://desktop.arcgis.com/
en/arcmap/latest/tools/spatial-analyst-toolbox/flow-distance.html


QGIS Terrain channels - https://docs.qgis.org/2.18/ en/docs/user_manual/processing_algs /saga/terrain_analysis_channels.html

Rennó, C. D., Nobre, A. D., Cuartas, L. A., Soares, J. V., Hodnett, M. G., & Tomasella, J. (2008). HAND, a new terrain descriptor using SRTM-DEM: Mapping terra-firme rainforest environments in Amazonia. Remote Sensing of Environment, 112(9), 3469-3481.

Nobre, A. D., Cuartas, L. A., Hodnett, M., Rennó, C. D., Rodrigues, G., Silveira, A., & Saleska, S. (2011). Height Above the Nearest Drainage – a hydrologically relevant new terrain model. Journal of Hydrology, 404(1-2), 13-29.

Nobre, A. D., Cuartas, L. A., Momo, M. R., Severo, D. L., Pinheiro, A., & Nobre, C. A. (2016). HAND contour: a new proxy predictor of inundation extent. Hydrological Processes, 30(2), 320-333.

Dilts, T. E., Yang, J., & Weisberg, P. J. (2010) Mapping Riparian Vegetation with Lidar Data Predicting plant community distribution using height above river and flood height. ArcUser Magazine - https://www.esri.com/news/arcuser/0110/mapping-with-lidar.html

Thursday, April 9, 2020

Finding the longest stream in each watershed using ArcGIS Network Analyst

Recently, I have found myself needing to identify the longest stream in a stream network for thousands of watersheds. Needless to say, doing this task manually is extremely time consuming.  Fortunately, there is a better way. Network Analyst in ArcGIS is a versatile tool that can be used to accomplish these tasks.  However, getting this workflow to work takes some finessing.  Here are the steps that I took.  Hopefully documenting these steps can help someone else.  All steps were completed in ArcGIS Desktop version 10.6.1.

Deriving the stream network:

In an arid environment, such as ours in Nevada USA, not all streams mapped by the USGS National Hydrography Network end up connecting to one another.  This can result in a disconnected stream network, which can make it really difficult to identify streams from headwaters down to pour points. I used the 1/3 arcsecond (10 meter) National Elevation Dataset Digital Elevation Model. I did the typical hydrological processing steps that included filling pits, calculating flow direction, and calculating flow accumulation.  I used a threshold of 40,000 cells to separate streams from non-streams.  The pour point

At this point I'll document the steps that I used to identify the longest stream in each watershed.

1.  Run the Feature Vertices to Points tool using the "BOTH" option.
2.  Run the Spatial Join tool specifying both the target and the join features as "vertices" from the previous step.
3.  This will create a new field called "Join_Count".  In the attribute table sort the Join_Count field, select Join_Count equal to 1 using a query similar to [Join_Count] = 1, and export the resulting selection to a new shapefile or geodatabase feature class. Name the new feature class "heads1" to represent the stream heads.
4.  Use the Snap tool in the Editing Toolbox. Snap the pour points to heads. I used a distance of 100 meters as my snapping distance.
5.  Use the Select by Location from the Selection menu at the top of the screen to identify "heads1" that intersect the snapped pour points.  Export the selection, name it "heads", and delete "heads1" from the previous step. This file represents stream heads but excludes pour points.


The image above shows the stream channels with each stream head mapped.

6. Network datasets exist within feature datasets within geodatabases. Create a new geodatabase, a new feature dataset within the geodatabase, and add heads, pour points, and streams to the feature dataset.
7. Create a new network dataset and add heads, pour points, and streams to the network dataset.  Keep the default settings, but don't allow turns or driving directions.


Geodatabase, feature dataset, network dataset with the channel heads, pour points, and streams participating in the network.


8.  Enable the Network Analyst extension (customize - extensions) and click on the Network Analyst Window from the Network Analyst Toolbar.
9.  Select "Create New OD Cost Matrix" from the drop down menu in the Network Analyst window.
10. In the Network Analyst menu right click on Origins and select Load.  Load the pour points.
11. In the Network Analyst menu right click on Destinations and select Load.  Load the heads points.
12. On the Network Analyst toolbar click the Solve button to identify all routes connecting pour points to channel heads.


The settings for the OD (origin-destination) matrix. The OD cost matrix using pour points as origins and channel heads as destinations.

13. In the Table of Contents right click on Lines in the OD Cost Matrix and export to a new feature class named "od_lines".


The origin-destination (OD) cost matrix depicts the distance from every pour point to every channel head as straight lines. However, the distances in the attribute table are in "stream network" distances and reflect network connectivity rather than Euclidean distance.

14. Run the Summary Statistics tool in the Analysis Toolset with OriginID as the case field and MAXIMUM of length as the summary field.
15. Join the summary statistics output table to the od_lines using the OriginID field.
16. Add a field called "Match" to the OD_lines shapefile and calculate it as [Total_Leng] = [MAX_Total_Leng]

17. Select records with Match = -1 and export as a new shapefile.

The image above shows the channel head that is furthest from the pour point of the watershed.

18. Use the Select by Location tool to identify channel heads that intersect the longest stream and export the feature class to the feature dataset that participates in the network dataset.
19. Right click on the network dataset and select Properties. Click Add and add the furthest_head feature class to the network dataset. Click OK.
20. Right click on the network dataset and click Build.

21. Add the updated network dataset into ArcMap.
22. In the Network Analyst window select "Closest Facility" from the drop down menu. Right click on Facilities and Load the pour points. Right click the Incidents and load the furthest_points.
23.  On the Network Analyst toolbar click Solve.
24. Right click onn Routes and click Data followed by Export Data to export the longest stream to its own feature class.


The image above shows the final longest stream from furthest channel head to pour point.

I'd be curious to hear if other people have more streamlined approaches to this.  I find Network Analyst to be quite efficient, but it involves a lot of steps.