Here is an example of how I've been using the tool.
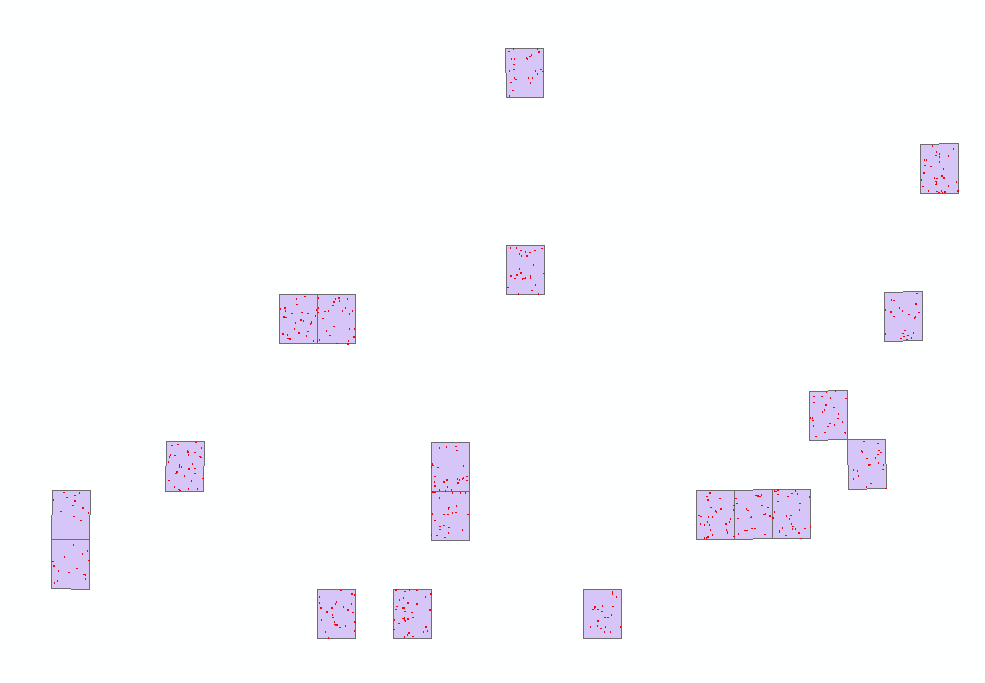
I'm in the process of classifiying NAIP imagery which will be used to generate training and validation for a Landsat model of tree cover. I've got 1348 random polygons scattered across 19 different NAIP tiles. In the left figure the purple polygons represent NAIP tiles and the tiny red dots are random points. Finding the cell count would involve 4 classes x 19 tiles = 76 runs of the Zonal Statistics tool in ArcGIS.

Some caveats: You may need to edit the code slightly if you wish to process more than 4 categories. There are instructions on how to do so in the python script itself. Before running the tool you will also need an index shapefile attributed with the name of each raster image. I did this using the create bounding box for geodatasets tool in the Marine Geospatial Ecology Tools.
No comments:
Post a Comment