Showing posts with label vegetation. Show all posts
Showing posts with label vegetation. Show all posts
Wednesday, August 29, 2018
Paper assigned to an issue - Contrasting climate niches among co‐occurring subdominant forbs of the sagebrush steppe
Our paper "Contrasting climate niches among co‐occurring subdominant forbs of the sagebrush steppe" has been assigned to an issue in Diversity and Distributions. It will be Barga, S.C., Dilts, T.E., & Leger, E.A. (2018) Contrasting climate niches among co‐occurring subdominant forbs of the sagebrush steppe. Diversity and Distributions, 24(9): 1291-1307. Good work Sarah!

Friday, July 13, 2018
New paper - Cheatgrass Die-Offs: A Unique Restoration Opportunity in Northern Nevada
Owen Baughman recently authored "Cheatgrass Die-Offs: A Unique Restoration Opportunity in Northern Nevada" in the journal Rangelands. This nice short piece highlights some of the restoration opportunities presented by cheatgrass die-offs. Cheatgrass die-off is a term that refers when a whole stand of cheatgrass fails to regenerate due to a pathogen. Usually this results in nearly complete lack of regeneration which can clearly be seen from both high resolution imagery and moderate resolution imagery, such as Landsat. Owen completed his master's thesis in 2014. I'd expect several papers related to his thesis out soon.
This paper also highlights some of the findings from our more detailed paper on remote sensing of cheatgrass die-offs "Development of remote sensing indicators for mapping episodic die-off of an invasive annual grass (Bromus tectorum) from the Landsat archive" in Ecological Indicators. The Great Basin Landscape Ecology Lab continues to explore ways in which remote sensing can be used to map cheatgrass die-offs across the Great Basin and to use imagery to quantify spatial pattern and relate it to climatic and other abiotic factors. Joe Brehm is a current master's student in the lab who is focusing on remote sensing of cheatgrass die-offs for his thesis. I'm looking forward to seeing Joe's findings.

Tuesday, March 27, 2018
New paper - Contrasting climate niches among co-occurring sub-dominant forbs of the sagebrush steppe
Sarah Barga, Beth Leger, and myself just got a paper accepted in Diversity and Distributions! It is titled "Contrasting climate niches among co-occurring sub-dominant forbs of the sagebrush steppe". The paper projects species distribution models for ten sub-dominant herbaceous forbs in the Great Basin. We then looked at niche overlap and found very little between the ten species. There was no relationship between phylogentic distance and niche overlap. We also looked at how species responded to temperature and precipitation variability and found that there were differences among different life forms. We hope that our paper findings will help conservationists understand which species may be more or less suitable to climatic variability.


Tuesday, October 25, 2016
New tool - Line Intercept Mapping for ArcGIS
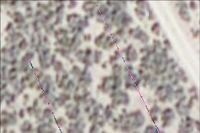
Line intercept is one of the most common sampling methods of sampling in ecology. Despite its widespread popularity a lack of tools exists for automatically importing and visualizing line interrcept data in a GIS. This tool alleviates this problem making line intercept mapping easier. The tool can be run using any of the three licensed versions of ArcGIS and does not require any extensions. The tool is capable of generating overlapping line segments. The tool does not require linear referencing because transect lines are assumed straight. The tool requires that your data be in two tables: a transect coordinate table and a start-stop table. The transect coordinate table should have four fields: a TransectID, easting (or longitude for the GCS version of the tool), northing (or latitude for the GCS version of the tool), and supposed line length (length of the line as measured in the field). The start-stop table requires four fields: a TransectID, a start distance, a stop distance, and at least one field with a descriptive attribute that you are trying to map.
Thursday, April 7, 2016
Historical ecology of the San Joaquin River Delta
I was having a discussion with a colleague recently and got reminded of some of the historical ecology work that has taken place in California. Robin Grossinger's historical ecology group at the San Francisco Estuary Institute does excellent detective work. Their work results in maps of how landscapes have changed over the past one hundred years or more and is changing how land managers actively manage lands and species. Kudos to Robin Grossinger, Allison Whipple, Erin Beller and other historical ecologists at the San Francisco Estuary Institute for a job well done, for affecting positive change on land management practices and ecosystem restoration, and for elevating the role of historical ecology!
http://www.npr.org/2012/10/07/162393931/restore-california-delta-to-what-exactly
http://www.npr.org/2012/10/07/162393931/restore-california-delta-to-what-exactly
Friday, February 12, 2016
New tool - Create Sampling Grid from Points for ArcGIS v. 1.0
With the advent of high-precision GPS spatially-explicit sampling designs have taken on an increasing importance in ecology and natural resource management. Spatially-explicit sampling regimes are useful for understanding processes such as attraction and repulsion that can be described using point pattern processes. This tool also opens up the possibility of random sampling within a larger grid. For example, users may want to collect field data to scale up to Landsat or MODIS pixels. It may be infeasible to collect data for an entire pixel, so some random sampling of the pixel may be necessary. Similarly there may be vegetation polygons or agricultural fields that the researcher wishes to sample in a random or a systematic manner. Finally, even if the researcher wishes to sample the entire grid having the ability to load center points or corner points onto a GPS and navigate to them may expedite field sampling. The creation of this tool was inspired by the needs of a current ongoing pygmy rabbit research project here in Nevada, Oregon, and Idaho.
This tool allows for the creation of polygons and centroids of polygons based on known points. The known points can be random locations, centroids of features of interest (e.g. polygons of agricultural fields or vegetation polygons), or regular gridded points across a landscape. This tool differs from existing tools, such as the Fishnet tools in ArcGIS, because it does not create a single grid for the entire landscape, but rather creates a local grid centered on each point in the input shapefile. It uses the following formula to achieve this:
(-1*(d/2) -
0.5) + i where d is the dimensions parameter and i is the iteration number. The two images below illustrate a grid with an even number of dimensions (6 on the left) and one with an odd number of dimensions (7 on the right). Both sampling grids are centered on points provided by the user, but the the one on the left has the original point (green) falling on a grid corner. The one on the right has the original point (provided by the user, in green) falling in the center of an individual grid tile. The maroon points were created using the 'Feature Vertices to Points' tool, a standard ArcGIS tool with the advanced license.


Subscribe to:
Posts (Atom)