|
Forest ecologists, vegetation ecologists, and others are
frequently interested in characterizing the structure of patches and gaps on
the landscape. Typically, data, such as tree crown size, are collected in
quadrats. In order to synthesize these data for each quadrat I developed the Patch
and Gap Metrics Toolbox for ArcGIS. This tool takes polygons of quadrats
combined with polygons of representing tree crowns, shrub crowns, or some other
patch on the landscape, and calculates the number of patches and area of those
patches as well as gaps. There is a version of the tool that allows the user to
specify a radius to filter the gaps by in order to ensure that only large gaps
are included in the output. You can download the tool by clicking HERE.
The Patch and Gap Metrics Toolbox only requires two input
layers: 1) a polygon shapefile of patches (need not be dissolved) and 2) a
polygon shapefile of quadrats. The quadrats can be any shape or size and can
even be overlapping. In addition to this the quadrat polygons need a quadrat ID
field upon which dissolving can be based on. Finally, for the version of the
tool that accommodates additional gap size criteria there is a parameter that
specifies the radius of gaps to be considered. For example, a value of 6 would
eliminate any gaps with a diameter less than 12.

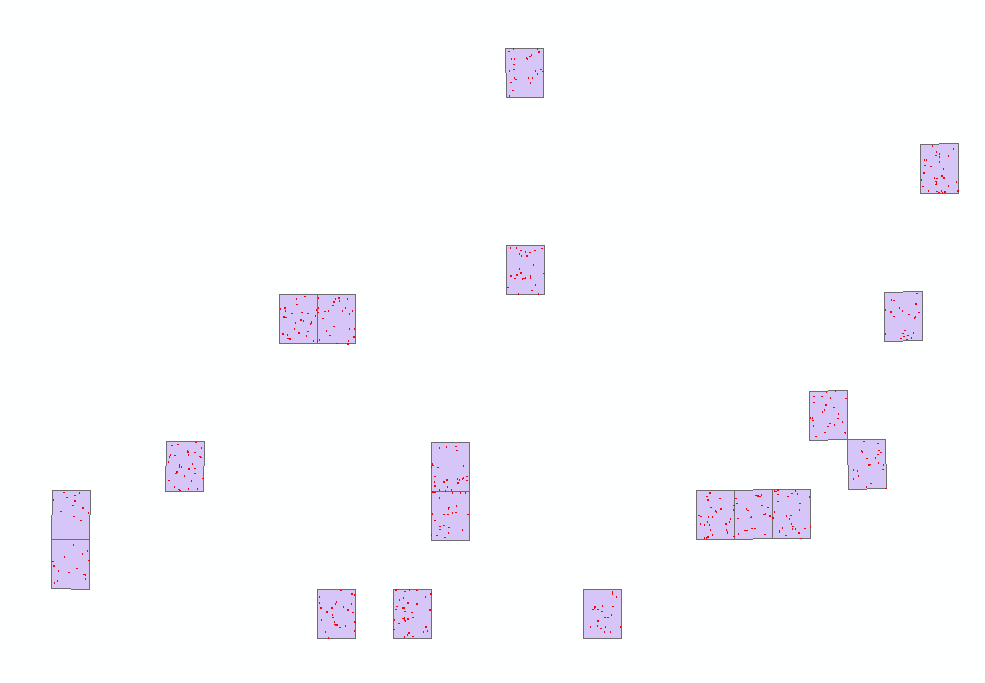
Above: There are two inputs required by the Patch and Gap
Metrics Toolbox. The picture on the left shows a polygon shapefile representing
the patches. Note that adjacent patches do not need to be merged. The tool will
do this automatically. The picture on the right shows overlapping quadrats.
Quadrats need not be overlapping.
The main output of this tool is a point shapefile
representing the centroid of each quadrat that is attributed with the following
fields:
COUNT_SHAPE – Count of the number of patches
SUM_ SHAPE – Total area of the patches in the quadrat
MEAN_ SHAPE – Average size of the patches in the quadrat
STD_ SHAPE – Standard deviation of the patches in the quadrat
MIN_SHAPE – Minimum number of patches in the quadrat
MAX_SHAPE - Maximum number of patches in the quadrat
SUM_ SHAPE1 - Total perimeter of patches in the quadrat
COUNT_SHAP_1 – Count of the number of gaps
SUM_ SHAP_1 - Total area of the gaps in the quadrat
MEAN_ SHAP_1 - Average size of the gaps in the quadrat
STD_ SHAP_1 – Standard deviation of the patches in the quadrat
MIN_ SHAP_1 - Minimum number of patches in the quadrat
MAX_ SHAP_1 - Maximum number of patches in the quadrat
SUM_ SHAP_2 – Total perimeter of gaps in the quadrat
SUM_ SHAPE – Total area of the patches in the quadrat
MEAN_ SHAPE – Average size of the patches in the quadrat
STD_ SHAPE – Standard deviation of the patches in the quadrat
MIN_SHAPE – Minimum number of patches in the quadrat
MAX_SHAPE - Maximum number of patches in the quadrat
SUM_ SHAPE1 - Total perimeter of patches in the quadrat
COUNT_SHAP_1 – Count of the number of gaps
SUM_ SHAP_1 - Total area of the gaps in the quadrat
MEAN_ SHAP_1 - Average size of the gaps in the quadrat
STD_ SHAP_1 – Standard deviation of the patches in the quadrat
MIN_ SHAP_1 - Minimum number of patches in the quadrat
MAX_ SHAP_1 - Maximum number of patches in the quadrat
SUM_ SHAP_2 – Total perimeter of gaps in the quadrat
In addition to attributing each quadrat centroid with the above values there are also two additional outputs. In the image below the darker green polygons with red outlines show patches as generated by this tool. The tan polygons with purple outlines show the gaps using a 6 meter radius filter. The remaining light green areas are classified as neither patch nor gap.
|