A while back I did a vegetation classification in ArcMap using data collected from a drone. The method was fairly simple and I was pretty pleased with the result. I wanted to simultaneously display the image and the classified map. I had seen some pretty nifty blended images on the web that were created in Photoshop, but since I don't have Photoshop on my computer I opted to try to figure out how to do this in ArcMap. In general, I followed the steps to this tutorial - https://blogs.esri.com/esri/arcgis/2008/10/14/fade-to-white-background-effect/
However, I took some liberties and deviated from it a bit. My classification was a raster so in order to accommodate that I sliced the raster up into discrete slices going from north to south. For each raster I set the transparency to increase by 7%. Likewise I did the same with the segment outlines (the black lines).
Below is the resulting image. In case you are interested in the actual vegetation here is what each color represents: blue = sagebrush, green = other shrub, pink = cheatgrass+forbs, tan = bare soil, and gray = dead shrub (rare in this image). The UAV image was take by AboveGeo near Doyle, California. The upper portion of the image is intact sagebrush desert while the lower part was previously burned.
With this blog I intend to share GIS, remote sensing, and spatial analysis tips, experiences, and techniques with others. Most of my work is in the field of Landscape Ecology, so there is a focus on ecological applications. Postings include tips and suggestions for data processing and day-to-day GIS tasks, links to my GIS tools and approaches, and links to scientific papers that I've been involved in.
Monday, March 26, 2018
Saturday, March 3, 2018
New tool - Patch and Gap Metrics Toolbox for ArcGIS
![]() |
Forest ecologists, vegetation ecologists, and others are
frequently interested in characterizing the structure of patches and gaps on
the landscape. Typically, data, such as tree crown size, are collected in
quadrats. In order to synthesize these data for each quadrat I developed the Patch
and Gap Metrics Toolbox for ArcGIS. This tool takes polygons of quadrats
combined with polygons of representing tree crowns, shrub crowns, or some other
patch on the landscape, and calculates the number of patches and area of those
patches as well as gaps. There is a version of the tool that allows the user to
specify a radius to filter the gaps by in order to ensure that only large gaps
are included in the output. You can download the tool by clicking HERE.
The Patch and Gap Metrics Toolbox only requires two input
layers: 1) a polygon shapefile of patches (need not be dissolved) and 2) a
polygon shapefile of quadrats. The quadrats can be any shape or size and can
even be overlapping. In addition to this the quadrat polygons need a quadrat ID
field upon which dissolving can be based on. Finally, for the version of the
tool that accommodates additional gap size criteria there is a parameter that
specifies the radius of gaps to be considered. For example, a value of 6 would
eliminate any gaps with a diameter less than 12.
Above: There are two inputs required by the Patch and Gap
Metrics Toolbox. The picture on the left shows a polygon shapefile representing
the patches. Note that adjacent patches do not need to be merged. The tool will
do this automatically. The picture on the right shows overlapping quadrats.
Quadrats need not be overlapping.
The main output of this tool is a point shapefile
representing the centroid of each quadrat that is attributed with the following
fields:
COUNT_SHAPE – Count of the number of patches
SUM_ SHAPE – Total area of the patches in the quadrat
MEAN_ SHAPE – Average size of the patches in the quadrat
STD_ SHAPE – Standard deviation of the patches in the quadrat
MIN_SHAPE – Minimum number of patches in the quadrat
MAX_SHAPE - Maximum number of patches in the quadrat
SUM_ SHAPE1 - Total perimeter of patches in the quadrat
COUNT_SHAP_1 – Count of the number of gaps
SUM_ SHAP_1 - Total area of the gaps in the quadrat
MEAN_ SHAP_1 - Average size of the gaps in the quadrat
STD_ SHAP_1 – Standard deviation of the patches in the quadrat
MIN_ SHAP_1 - Minimum number of patches in the quadrat
MAX_ SHAP_1 - Maximum number of patches in the quadrat
SUM_ SHAP_2 – Total perimeter of gaps in the quadrat
SUM_ SHAPE – Total area of the patches in the quadrat
MEAN_ SHAPE – Average size of the patches in the quadrat
STD_ SHAPE – Standard deviation of the patches in the quadrat
MIN_SHAPE – Minimum number of patches in the quadrat
MAX_SHAPE - Maximum number of patches in the quadrat
SUM_ SHAPE1 - Total perimeter of patches in the quadrat
COUNT_SHAP_1 – Count of the number of gaps
SUM_ SHAP_1 - Total area of the gaps in the quadrat
MEAN_ SHAP_1 - Average size of the gaps in the quadrat
STD_ SHAP_1 – Standard deviation of the patches in the quadrat
MIN_ SHAP_1 - Minimum number of patches in the quadrat
MAX_ SHAP_1 - Maximum number of patches in the quadrat
SUM_ SHAP_2 – Total perimeter of gaps in the quadrat
In addition to attributing each quadrat centroid with the above values there are also two additional outputs. In the image below the darker green polygons with red outlines show patches as generated by this tool. The tan polygons with purple outlines show the gaps using a 6 meter radius filter. The remaining light green areas are classified as neither patch nor gap.
![]() |
Tuesday, January 23, 2018
New tool - spider diagrams for ArcMap
There have been various renditions of tools for generating spider diagram tools in ArcMap throughout the years. Over time as many of the Esri tool-posting websites have become defunct these third party tools have become difficult to find. I decided to put together a simple tool for generating spider diagrams for my own purposes and decided to share it.
Spider lines depict Euclidean distance-based routes that connect each pair of points. They are a useful tool for visualization. In landscape genetics this represents the isolation-by-distance hypothesis. Previously there were other 3rd party tools that achieved this on the Arcscripts website. Currently it appears that this functionality is only available with a Business Analyst license of ArcGIS. This tool make a few assumptions:
1. You wish to connect all pairs of points
2. You have a point shapefile
3. The point shapefile is in a projected coordinate system
4. The point shapefile has fields called "Easting" and "Northing" that represent the X and Y coordinates respectively. If these fields are not named this excatly then the tool will fail
5. You have a field that describes the name of the pairs of the site (point).
Please do not use a geodatabase feature class.
Output line shapefile (or geodatabase if you specify that) attributed with the following:
1. Input FID
2. Easting
3. Northing
4. Easting_1
5. Northing_1
6. Near_FID
7. Site
8. Site_1
If you end up using this tool for published work please feel free to cite this as:
Dilts, T.E. (2018) Spider Diagram Tools for ArcGIS (insert your version here). University of Nevada Reno, Available at: https://www.arcgis.com/home/item.html?id=fb7d157782a549b182c957abbaaf45c2.
You can download the tool by clicking HERE.
Spider lines depict Euclidean distance-based routes that connect each pair of points. They are a useful tool for visualization. In landscape genetics this represents the isolation-by-distance hypothesis. Previously there were other 3rd party tools that achieved this on the Arcscripts website. Currently it appears that this functionality is only available with a Business Analyst license of ArcGIS. This tool make a few assumptions:
1. You wish to connect all pairs of points
2. You have a point shapefile
3. The point shapefile is in a projected coordinate system
4. The point shapefile has fields called "Easting" and "Northing" that represent the X and Y coordinates respectively. If these fields are not named this excatly then the tool will fail
5. You have a field that describes the name of the pairs of the site (point).
Please do not use a geodatabase feature class.
Output line shapefile (or geodatabase if you specify that) attributed with the following:
1. Input FID
2. Easting
3. Northing
4. Easting_1
5. Northing_1
6. Near_FID
7. Site
8. Site_1
If you end up using this tool for published work please feel free to cite this as:
Dilts, T.E. (2018) Spider Diagram Tools for ArcGIS (insert your version here). University of Nevada Reno, Available at: https://www.arcgis.com/home/item.html?id=fb7d157782a549b182c957abbaaf45c2.
You can download the tool by clicking HERE.
Thursday, August 10, 2017
Interesting finds in aerial photography
Every once in a while I encounter really interesting stuff when looking at digital elevation models and imagery in a GIS. Today is one of those days. In the image below (40.8154 N 119.3856 W decimal degrees) the stream in the upper part of the image is flowing in two directions. On the USGS topographic map it is named Rock Creek and flows to the south, but in the aerial photography it is quite evident that it also flows to the north at least some of the time.
In the image below I've zoomed in and see that a small jeep track may have caused an entire stream to shift from one basin into another (at least part of the time).
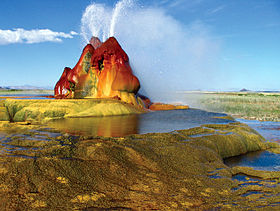
Interestingly, all of this is uphill and to the west of the cool and funky attraction known as Fly Geyser adjacent to the Black Rock Desert.
In the image below I've zoomed in and see that a small jeep track may have caused an entire stream to shift from one basin into another (at least part of the time).
Interestingly, all of this is uphill and to the west of the cool and funky attraction known as Fly Geyser adjacent to the Black Rock Desert.
Wednesday, August 9, 2017
Tuesday, June 27, 2017
Text of Section 11 - The Geospatial Data Act (GDA) of 2017 (S.1253)
Update: Section 11 of the proposed Geospatial Data Act (GDA) of 2017 did end up getting removed.
Although the title of my last blog post "The Geospatial Data Act (GDA) of 2017 (S.1253) intends to kill our jobs" may sound dramatic and unlikely, a quick read of section 11 in the bill shows that it is clearly not. The vast majority of GIS professionals are not licensed engineers, surveyors, and architects. While I very much appreciate the work that these folks do the implications of Section 11 of this bill are big. This bill essentially means that geological maps will be made by engineering firms rather than by structural geologists. Habitat mapping will be done by engineering firms rather than federal, state, and academic biologists. Weather maps won't be made by NOAA and NWS any more.
SEC. 11. USE OF THE PRIVATE SECTOR.
(a) In General.--The Committee and each covered agency shall, to
the maximum extent practical, rely upon and use private individuals and
entities in the United States for the acquisition of commercially
available surveying and mapping and the provision of geospatial data
and services. The Federal Government shall not commence or continue any
surveying and mapping activity to provide, duplicate, or compete with a
commercial product or service if the product or service is available on
a more economical basis from a commercial source
(b) Definition.--For purposes of selecting a firm for a contract
under chapter 11 of title 40, United States Code, the term ``surveying
and mapping'' shall have the meaning given the term ``geospatial data''
in section 2 of this Act.
(c) Modification of Federal Acquisition Regulation.--Part 36 of the
Federal Acquisition Regulation (48 C.F.R. 36.000 et seq.) shall be
revised to specify that the definition of the term ``architectural and
engineering services'' includes surveying and mapping services and the
acquisition of geospatial data, to which the selection procedures of
subpart 36.6 of such part 36 of the Federal Acquisition Regulation
shall apply.
The Geospatial Data Act (GDA) of 2017 (S.1253) intends to kill our jobs
Nevada's own senator, Dean Heller, is sponsoring legislation that will make it illegal for anyone but a licensed engineer to procure federal government contracts having to do with anything geospatial. The language of this act is very broadly worded. In fact, it is so broadly worded that it actually would apply to "all information tied to a location on Earth". This is clearly a money grab on the part of the surveying and engineering community, and an attempt to squash GIS and remote sensing as we know it. Please take a look at the statement released by the Association of American Geographers - http://news.aag.org/2017/06/the-new-plot-to-hijack-gis-and-mapping/ and please take a look at the full text of the bill at - https://www.congress.gov/bill/115th-congress/senate-bill/1253/text?format=txt . Finally, if you live in Nevada contact Dean Heller at https://www.deanheller.com/contact/ . GIS and geospatial data goes way beyond engineeringor surveying. It affects virtually every corner of science and social science. Please make your voice heard. Orrin Hatch of Utah, Ron Wyden of Oregon, and Mark Warner of West Virginia are also co-sponsors of this money-grab legislation. Please let you congressional delegation know that you oppose this legislation.
Subscribe to:
Posts (Atom)