One of the most common tasks is habitat modeling, animal movement modeling, etc. is creating a percentile raster from a raw output. I created a small tool that will do this and identify animal stopovers from Brownian Bridge Movement Models (BBMM). The tool works in ArcGIS and is available HERE for download.
Here is an example of how the Identify Stopovers tool works. Thanks to Marcus Blum for providing test data and testing this tool.
First you start with a raster, probably continuous floating point values. In this case it is the ASCII raster output of Brownian Bridge Movement Models (BBMM).
After running the tool we get a percentile raster as one of the outputs. If you are just interested in getting a percentile raster you can run the Create Percentile Raster tool.
The maps look really similar, but if we compare them using the identify tool in ArcMap we can see that the original data has values that are different from the percentile raster.
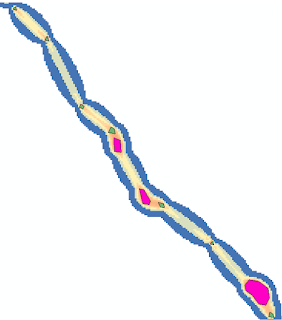
Finally, we get two polygons called "stopovers1" and "stopovers2". The difference between these two stopovers files is that stopovers1 includes small stopovers. In contrast, stopovers2 omits stopovers that consist of only a handful of cells.
With this blog I intend to share GIS, remote sensing, and spatial analysis tips, experiences, and techniques with others. Most of my work is in the field of Landscape Ecology, so there is a focus on ecological applications. Postings include tips and suggestions for data processing and day-to-day GIS tasks, links to my GIS tools and approaches, and links to scientific papers that I've been involved in.
Friday, August 24, 2018
New tool - Create Percentiles Raster and Identify Stopovers
Labels:
animal movement,
BBMM,
Brownian Bridge,
integer,
percentile,
rank,
raster,
stopovers
Subscribe to:
Post Comments (Atom)
No comments:
Post a Comment