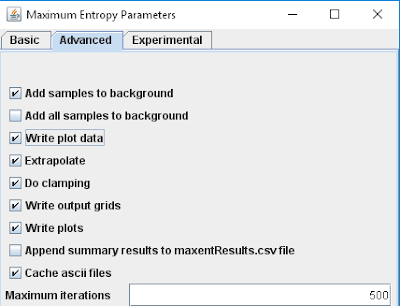
Although there are a number of digitizing software packages out there I'd suggest that for a GIS professional that GIS software might be the way to go. I recently had a case where I undertook this myself. As a quick aside it is easier to generate the data while running models. Always search your software to see if there are options for outputting the data used to build the graphs to some sort of common file type such as a CSV file. For example, Maxent software has a button that needs to checked on to output these files (see below). It is the write plot data checkbox under the Advanced tab in the older version of Maxent.
Now, back to my case study. I found myself with these terrible default graphs from Maxent (see below). No journal editor in their right mind would ever publish something like this. The font is far too small to read and there is some unnecessary titles in which the information would be in the caption in a journal manuscript. I needed something cleaner and nicer, but unfortunately I had forgotten to check the above mentioned box years ago when I did the study.
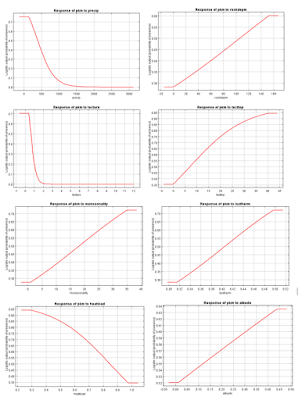
Instead I used ArcMap to take screenshots and digitize the values in order to clean up the data. Here is my workflow:
First I zoomed in and took more detailed screenshots. I used standard tools on any windows computer such as the PrtScrn button and the paint software. This resulted in a graph like the one below.
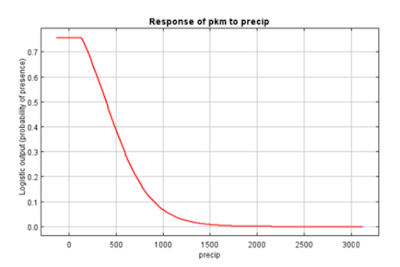
Next I imported this into ArcMap, which was as simple as dragging the file in from my desktop into an empty ArcMap instance with a data frame with an undefined projection. In ArcMap I digitized a smooth line designed to replicate the line from the Maxent software like the one below.
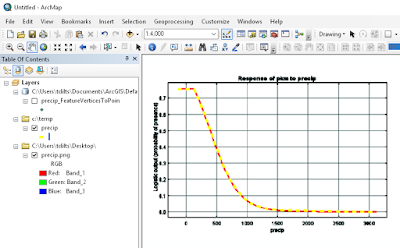
I ran a tool called Feature Vertices to Points to convert the lines to points. Feature Vertices to Points uses an Advanced license of ArcMap. If you don't have that license or want to skip the conversion I'd suggest just digitizing the points directly.
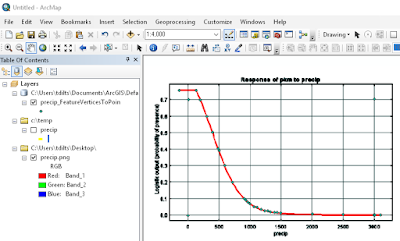
The result of the Feature Vertices to Points to conversion is shown in the image above. At this point in the process I also digitize in four additional points with known X and Y coordinates on the graph. Next I run the Add XY tool to obtain the X and Y coordinates (these are in arbitrary units). I add two additional fields called X and Y which I create as double precision. In the Field Calculator I use the following formula to calculate the X field:
(((newmax - newmin) / (oldmax - oldmin)) * ( [POINT_X] - oldmin)) + newmin
where newmax is the maximum X value of the digitized reference point as read off of the graph
where newmin is the minimum X value of the digitized reference point as read off of the graph
where oldmax is the maximum X value of the digitized reference point as calculated from the Add XY tool
where oldmin is the minimum X value of the digitized reference point as calculated from the Add XY tool
and [POINT_X] is the value from the POINT_X field in the table
The result of this and a similar formula applied to the Y value is shown below.

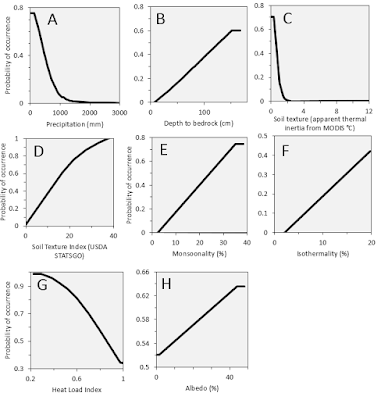
Finally I highlight the top rows skipping the four reference points and copy the data into Excel. As an alternative workflow I could have applied the field calculator formulas in Excel. Now with a little finessing in Excel (or R or whatever software you prefer) you can get some clean nice graphs like the ones below.
A sneaky use of GIS!
ReplyDelete