 One of the main purposes of a Geographic Information System is to
extract information. We do this all
One possible solution to his problem was the use of focal statistics rather than zonal statistics for extracting information. This works especially well for buffers around points since the buffers will always be the same size. Focal statistics provide options for rectangle buffers or circular buffers. Focal statistics are nice because if new points are added then the rasters are already there. There is no need to re-run anything other than extracting the values to points. Focal statistics are sensitive to edge effects so be cautious with points located near the boundary of a raster.

Zonal statistics, on the other hand, are preferable in situations with irregularly shaped zones (often polygons) like watersheds or administrative units like counties. Zonal statistics can be made to work with overlapping polygons with a little extra work. Usually this involves unioning the overlapping polygons, finding areas common to more than one point, and then doing some sort of area weighted average.
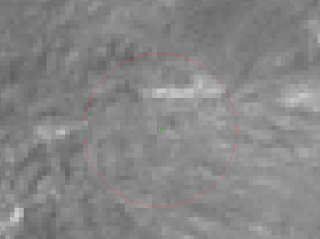
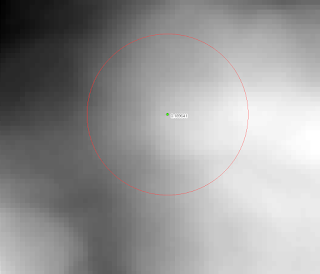
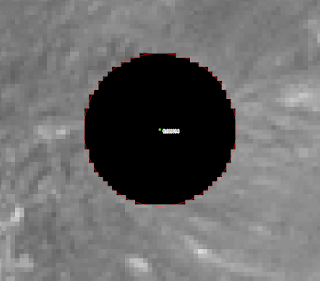
In the examples on the right we have a buffered point and underlying raster (top), buffered point on a focal mean raster (middle), and a buffered point that has had zonal statistics run on it (bottom). Focal statistics yielded a value of 0.189641 and zonal statistics got us 0.189814. The differences are probably due to a single or a small handful of cells that differed as to whether they were included or not in the buffer. I think that for the many applications this small of a discrepancy shouldn't matter.
No comments:
Post a Comment